Rd Sharma Solutions Class 6 Chapter 23 Data Handling – III Bar Graphs
Welcome to NCTB Solution. Here with this post we are going to help 6th class students for the Solutions of Rd Sharma Class 6 Mathematics, Chapter 23, Data Handling – III (Bar Graphs). Here students can easily find Exercise wise solution for chapter 23, Data Handling – III (Bar Graphs). Students will find proper solutions for Exercise 23.1 and 23.2. Our teachers solved every problem with easily understandable methods so that every students can understand easily. Here all solutions are based on the CBSE latest curriculum.
Data Handling – III (Bar Graphs) Exercise 23.1 Solution
Question no – (1)
Solution :
Let, A TV pic = 50 TV is
| Days | Number of icons of T.V. |
| Mon | 300/50 = 6 |
| Tue | 400/50 = 8 |
| Wed | 150/50 = 3 |
| Thurs | 250/50 = 5 |
| Fri | 100/50 = 2 |
| Sat | 350/50 = 7 |
| Sun | 200/50 = 4 |
Now,
| Days | Number of Icons |
| Mon | 📺📺📺📺📺📺 |
| Tue | 📺📺📺📺📺📺📺📺 |
| Wed | 📺📺📺 |
| Thurs | 📺📺📺📺📺 |
| Fri | 📺📺 |
| Sat | 📺📺📺📺📺📺📺 |
| Sun | 📺📺📺📺 |
Question no – (2)
Solution :
Let, 1 car icon = 5 Maruti
| Dealer | No of cars sold icons |
| Saya | 60/5 = 12 |
| Bagga dinks | 40/5 = 8 |
| D.D. Motors | 20/5 = 4 |
| Bhasin Motor | 15/5 = 3 |
| Competent Motors | 10/5 = 2 |
Now, in pictograph,
| Dealer | Number of cars sold icons |
| Saya | 🚗🚗🚗🚗🚗🚗 |
| Bagga dinks | 🚗🚗🚗🚗🚗🚗🚗🚗 |
| D.D. Motors | 🚗🚗🚗🚗 |
| Bhasin Motor | 🚗🚗🚗 |
| Competent Motors | 🚗🚗 |
Question no – (3)
Solution :
The above information with help of a bar graph as follows :
Question no – (4)
Solution :
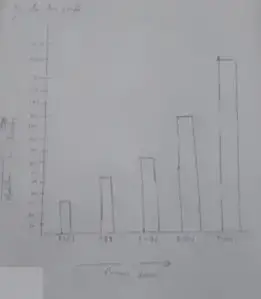
(i) The bar graph represents the no of tickets of different state batteries sold by an agent on a day.
(ii) 40 tickets of Assam state lottery were sold by the agent
(iii) The maximum no of tickets sold in Haryana state
(iv) The statement is False.
(v) Minimum no of tickets sold in Rajasthan state.
Question no – (5)
Solution :
(i) What is the percentage of the youngest age-group persons over those in the oldest age group?
Number of persons in youngest age group = 1400
Number of persons in oldest age group = 300
∴ Difference
= (1400 = 300)
= 1100
Required percentage
= (1100/300 × 100)
= 366 2/3%
(ii) What is the total population of the town?
Total population of the town
= 1400 + 120 0 + 1100 + 1000 + 900 + 800 + 300 + 6700
(iii) In the age group 60 – 65 the no of persons are 800.
(iv) How many persons are more in the age-group living in the town?
Number of persons in the age group 50 – 15 = 1400
and, No of persons in the age group 30 – 35 = 1100
(1400 – 1100) = 300 more in the age group 10 – 15
(v) What is the age-group of exactly 1200 persons living in the town?
= 1200 people are living in the age group 20 – 25 years.
(vi) Total no of persons is 900 in age group 50 – 55.
(vii) 1400 persons living in the age group 10 – 15 and 800 persons living in the age
group 60 – 65
Total numbers,
= (1400 + 800)
= 2200
(viii) Here, the population decreases with the increase in the age group.
Question no – (6)
Solution :
(i) The bar graph represents the no of commercial banks in India during some years
(ii) The no of commercial banks in 1977 was 130.
(iii) No of commercial banks in 1969 = 90
(iv) The statement is False.
Question no – (7)
Solution :
Required Chart,
| Marks | No of students |
| 0 – 9 | 27 |
| 10 – 19 | 12 |
| 20 – 29 | 20 |
| 30 – 39 | 24 |
| 40 – 49 | 17 |
(i) No of students who scores has been than 20 marks
= 27 + 12
= 39
Amount required to buy book
= (5 × 39) Rs
= 195 Rs
(ii) No of students in the highest mark group (40 – 49) is = 17
∴ Money required
= (10 × 17)
= 170 Rs
(iii) No of students in the lowest mark groups (0 – 9) is = 27
∴ No of Problems should = (5 × 27)
= 135
(iv) – (a) This statement is (True).
(b) This statement is (False)
(v) What is the number of students getting less than 20 marks?
Solution:
No of students getting less than 20 marks
= (27 + 12)
= 39
(vi) No of Students getting more than 29 marks
= (24 + 17)
= 41
(vii) No of students getting marks between 9 to 40
= 12 + 20 + 24
= 56
(viii) No of students belonging to the highest mark group 17,
(ix) No of students obtaining more than 19 marks
= (20 + 21 + 17)
= 61
Question no – (8)
Solution :
(i) What is the information given by the bar graph?
= The bar graph represents the number of government companies in India during years.
(ii) (a) The number of government companies in 1957 is that of 1982 is 1 : 9.
= (False)
(b) The number of government companies have decreased over the year 1957 to 1983.
= (True)
Question no – (9)
Solution :
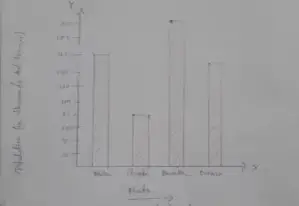
(i) The bar graph represents information regarding rice and wheat production in various states.
(ii) The lowest producer rice is WB.
(iii) The lowest producer of wheat is up.
(iv) W.P has the total production of rice and wheat as its maximum.
(v) Maharashtra has the total production of wheat and rice is minimum.
Question no – (10)
Solution :
(i) No of students having highest more than 149 cm
= 17 + 9 + 5
= 31
Total students = 50
∴ Percentage of students having highest more than 149 cm
= 31/50 × 100
= 62%
(ii) Total 5 students, in maximum highest range of the clan
= 160 – 164
(iii) No of students having highest less than 150 cm
= 7 + 12
= 19
∴ Amount required,
= (19 × 55) Rs
= 1045 Rs
(iv) No of students in minimum highest range is 17.
(v) State whether true or false:
(a) This statement is (True)
(b) This statement is (False)
(c) This statement is (True)
(d) This statement is (True)
(e) This statement is (False)
(f) This statement is (True)
Question no – (11)
Solution :
(i) The bar graph represents industrial production of comet in different years in India.
(ii) The production of cement in the year 1980 – 21is 186 lakh tones.
(iii) The minimum highest of production 30 lakh tones.
= Maximum production 232 lakh tones.
Question no – (12)
Solution :
(i) Total no of newspapers published
= (3700 + 3400 + 700 + 200 + 1100)
= 9100
(ii) No of newspapers published in Hindi 3700
Total papers published = 14400
∴ % of Hindi newspapers published
= 3700/14400 × 100
= 25.7 %
(iii) Excess no of newspapers which are published in
= English over Urdu
= (3400 – 700)
= 2700
(iv) Guajarati and Bengali, Marathi and Malayalam
(v) The smallest no of newspapers are published in Panjabi language.
(vi) Maximum no of newspaper published in Hindi language
(vii) English language
(viii) State whether true or false :
(a) This statement is (True)
(b) This statement is (False)
Data Handling – III (Bar Graphs) Exercise 23.2 Solution
Question no – (2)
Solution :
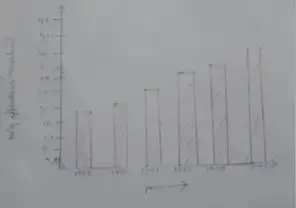
(i) The bar graph gives information regarding import and export from 1982 – 83 to 1986 – 87
(ii) Export is minimum in 1982 – 83
(iii) Import is maximum is 1986 – 87
(iv) 1886 – 87
Question no – (3)
Solution :
(i) The correct option is (b) VI, IX
(ii) The correct option is (a) VII
(iii) The correct option is (b) VII
Question no – (4)
Solution :
(i) The correct alternative is (b) 1997
(ii) The correct alternative is (a) 1996
(iii) The correct alternative is (a) 1995
Question no – (5)
Solution :
Scale 1 big divisions = 20 thousand tonnes
Let, take 1 division = 20 thousand tonnes.
Required Bar graph :
Question no – (6)
Solution :
Let, 1 division = 4 thousand application.
Previous Chapter Solution :
👉 Chapter 22 👈