Warning: Undefined array key "https://nctbsolution.com/ncert-exemplar-solutions-class-6-mathematics/" in /home/862143.cloudwaysapps.com/hpawmczmfj/public_html/wp-content/plugins/wpa-seo-auto-linker/wpa-seo-auto-linker.php on line 192
Ncert exemplar Solutions Class 6 Mathematics Data Handling
Welcome to NCTB Solutions. Here with this post we are going to help 6th class students for the Solutions of NCERT Class 6 Mathematics Book, Unit 5, Data Handling. Here students can easily find step by step solutions of all the problems for Data Handling, Also here our mathematics teacher’s are solved all the problems with easily understandable methods with proper guidance so that all the students can understand easily. Here in this post students will get Unit 5 solutions.
Data Handling Unit 5 Solution :
Multiple Choice Questions :
Question no – (1)
Using tally marks, which one of the following represents the number eight
Solution :
We use standard representation.
For 5 we draw 4 lines and 1 line cross the 4 lines
Hence, the number 8 is represented as option – (D)
Question no – (2)
The marks (out of 10) obtained by 28 students in a Mathematics test are listed as below
Solution :
The marks (out of 10) obtained by 28 students in a Mathematics test is given.
The number of students who obtained marks more than or equal to 5 is 17.
Thus, the correct answer is option (D) 17
Question no – (3)
In question 2 above, the number of students who scored marks less than 4 is
Solution :
The number of students who scored marks less than 4 is 10
So, the correct answer is option – (D) 10.
Question no – (4)
The choices of the fruits of 42 students in a class are as follows
Solution :
The choices of the fruits of 42 students in a class are given:
A, O , B , M , A , G , B , G , A , G , B , M , A , G , M , A , B , G , M , B , A , O , M , O , G , B , O , M , G , A , A , B , M , O , M , G , B , A , M , O , M , O. A, B, G, M and O stand for the fruits Apple, Banana, Grapes, Mango and Orange respectively.
From above data,
Apple like by (A) 9 students.
Banana like by (B) 8 students.
Grapes like by (G) 8 students.
Mango like by (M) 10 students.
Orange like by (M) 7 students.
Two fruits are liked by an equal number of students is Banana and Grapes.
Therefore, the correct answer is option – (D) B and G
Question no – (5)
According to data of question 4, which fruit is liked by most of the students?
Solution :
From above data,
Apple like by (A) 9 students.
Banana like by (B) 8 students.
Grapes like by (G) 8 students.
Mango like by (M) 10 students.
Orange like by (M) 7 students.
Mango fruit is like by most students.
Hence, correct answer is option – (C) M
State True or False :
Question no – (6)
Solution :
In a bar graph, the width of bars may be unequal – This statement is False.
Because, in a bar graph, the width of bars always equal.
Question no – (7)
Solution :
In a bar graph, bars of uniform width are drawn vertically only
This statement is False.
Because, in a bar graph, bars of uniform width are drawn vertically and horizontally in both directions.
Question no – (8)
Solution :
In a bar graph, the gap between two consecutive bars may not be the same
This statement is False.
Because, in a bar graph, the gap between two consecutive bars is same.
Question no – (9)
Solution :
In a bar graph, each bar (rectangle) represents only one value of the numerical data.
Given statement is True.
Reason : In a bar graph each bar represent only one value of data.
Question no – (10)
Solution :
To represent the population of different towns using bar graph, it is convenient to take one unit length to represent one person
This statement is False.
Because, to represent the population of different towns using bar graph, it is not convenient to take one unit length to represent one person.
Question no – (11)
Solution :
Pictographs and bar graphs are pictorial representations of the numerical data
Given statement is True.
Explanation :
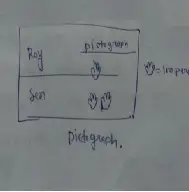
Pictograph and bar graph are pictorial representation of numerical data.
Such as a numerical data,
| Surname : | Number of people : |
| Roy | 100 |
| Sen | 200 |
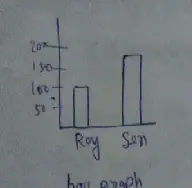
We can represent it through bar graph and pictograph,
Pictograph :
Bar graph :
Question no – (12)
Solution :
An observation occurring five times in a data is recorded as | | | | |, using tally marks.
Given statement is False.
Explanation :
An observation occurring five times in a data is recorded as ||||/ using tally mark.
Question no – (13)
Solution :
In a pictograph, if a symbol represents 50 books in a library shelf, then the symbol represents 25 books
Given statement is True.
Explanation :
Yes, In a pictograph it a symbol represent 50 books it’s half represent 25 books.
Fill in the blanks :
Question no – (14)
Solution :
A data is a collection of numbers gathered to give some meaningful information.
Question no – (15)
Solution :
The data can be arranged in a tabular form using Tally marks.
Question no – (16)
Solution :
A Pictograph represents data through pictures of objects.
Question no – (17)
Solution :
In a bar graph, Bars can be drawn horizontally or vertically.
Question no – (18)
Solution :
In a bar graph, bars of Uniform width can be drawn horizontally or vertically with Equal spacing between them.
Question no – (19)
Solution :
An observation occurring seven times in a data is represented as ||||/ || using tally marks.
Question no – (20)
Solution :
In a pictograph, if a symbol 🌸 represents 20 flowers in a basket then 🌸🌸🌸 stands for 60 flowers.
Explanation :
🌸 = 20
🌸🌸🌸 = 20 + 20 + 20 = 60
Question no – (21)
Solution :
On the scale of 1 unit length = 10 crore, the bar of length 6 units will represent 60 crore and of 75 units will represent 75 crore.
1 unit length = 10 crore
6 units = we multiply 6 by 10 crore
6 units = 6 x 10 crore = 60 crore
75 crore. = We divide 75 crore by 10 crore.
75 crore / 10 crore = 7.5 unit
Question no – (22)
Solution :
| Grades : | Tally marks : |
| A | ||| |
| B | ||||/ || |
| C | ||||/ ||||/ |
| D | ||||/ | |
| E | |||| |
Question no – (23)
Solution :
| Number of Wheels : | Number of families : | Tally mark : |
| 0 | 3 | ||| |
| 1 | 28 | ||||/ ||||/ ||||/ ||||/ ||||/ ||| |
| 2 | 14 | ||||/ ||||/ |||| |
| 3 | 4 | |||| |
| 4 | 1 | | |
Number of families having two or more, two wheelers is 19
Question no – (24)
Solution :
| Length (cm) : | Number of carrot : | Tally marks : |
| 15 | 5 | ||||/ |
| 18 | 6 | ||||/ | |
| 20 | 9 | ||||/ |||| |
| 21 | 6 | ||||/ | |
| 22 | 4 | |||| |
(a) What is the number of carrots which have length more than 20 cm?
Number of carrots having length more than 20 cm is 10.
(b) Which length of the carrots occur maximum number of times? Minimum number of times?
= 20 cm length of the carrots occur maximum number of times.
= 22 cm length of the carrots occur minimum number of times.
Question no – (25)
Solution :
Given data in a table using tally marks :
| Responses | No. Of Response | Tally Mark |
| Doctor | 10 | ||||/ ||||/ |
| Engineer | 6 | ||||/ | |
| Pilot | 8 | ||||/ ||| |
| Officer | 6 | ||||/ | |
Question no – (26)
Solution :
Given choices of games in a table using tally marks :
| Games | Student | Tally mark |
| Football | 13 | ||||/ ||||/ ||| |
| Cricket | 9 | ||||/ |||| |
| Khokho | 6 | ||||/ | |
| Tennis | 4 | |||| |
| Hocky | 8 | ||||/ ||| |
(b) Which game is liked by most of the students?
= Football is liked by Most of the students.
(c) Which game is liked by minimum number of students?
= Tennis is liked by minimum number of students.
Question no – (27)
Solution :
Table represents shirt size of 40 students of a school :
| Shirt size : | Tally marks : | Number of Students : |
| 30 | ||| | 3 |
| 32 | ||||/ | 5 |
| 34 | ||||/ ||| | 8 |
| 36 | ||||/ || | 7 |
| 38 | ||||/ ||||/ | 10 |
| 40 | ||||/ || | 7 |
Question no – (28)
Solution :
(a) 400 have surname ‘Roy’.
(b) ‘Patel’ surname appears the least number of times in the directory.
(c) ‘Saikia’ Surname appears the least number of times in the directory.
(d) Two surnames Rao and Roy appear an equal number of times.
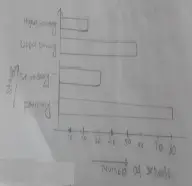
Question no – (29)
Solution :
(a) Metal is Used in maximum number of articles.
(b) Material ‘Glass’ is used in minimum number of articles.
(c) Rubber is used in exactly half the number of articles as those made up metal.
(d) The total number of articles counted by the students is 160.
Question no – (30)
Solution :
(a) Class X has the minimum number of scouts.
(b) Class VIII has the maximum number of scouts.
(c) There are 40 scouts in class VI.
(d) Class VI has exactly four times the scouts as that of class x.
(e) The total number of scouts in the always VI to X is 160.
Question no – (31)
Solution :
(a) Hindi is most popular among the students.
(b) 175 students like mathematics.
(c) The number of students who like subjects other than mathematics and science is 425.
Question no – (32)
Solution :
(a) The area of Koria district is 6000 sq.km
(b) Two district Raigarh and Joshpur have the same area.
(c) 4 District have area more than 5000 square km.
Question no – (33)
Solution :
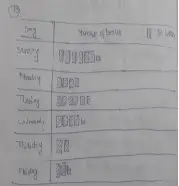
| Day | Number of bottles 🍾 = 50 |
| Sunday | 🍾🍾🍾🍾🍾🍾 |
| Monday | 🍾🍾🍾🍾 |
| Tuesday | 🍾🍾🍾🍾🍾🍾 |
| Wednesday | 🍾🍾🍾🍾🍾 |
| Thursday | 🍾🍾 |
| Thursday | 🍾🍾 |
For more better understanding :
Question no – (34)
Solution :
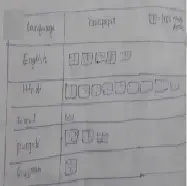
| Language | Newspaper 📰 = 1000 newspaper |
| English | 📰📰📰📰📰 |
| Hindi | 📰📰📰📰📰📰📰📰📰 |
| Tamil | 📰 |
| Punjab | 📰📰📰 |
| Gujrati | 📰 |
For more better Understanding :
Question no – (35)
Solution :
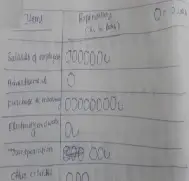
| Items | Expenditure (Rs in lakh) 💰 = 10 lakh |
| Salaries of employees | 💰💰💰💰💰💰💰 |
| Advertisement | 💰 |
| Purchase of machinery | 💰💰💰💰💰💰💰💰💰 |
| Electricity and water | 💰💰 |
| Transportation | 💰💰💰 |
| Other expenses | 💰💰💰 |
For more better understanding :
Question no – (36)
Solution :
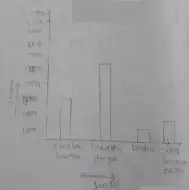
(a) Which fuel is used in maximum number of houses?
LPG is used in maximum number of house.
(b) How many houses are using coal as fuel?
10 houses are using cool as fuel.
(c) Suppose that the total number of houses in the town is 1 lakh. From the above graph estimate the number of houses using electricity
The number of house using electricity is 500
Question no – (37)
Solution :
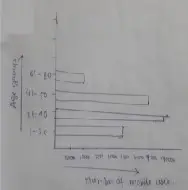
(a) The number of students whose shoe sizes have been collected is 1300
(b) The number of students wearing size 6 is 300.
(c) 4, 5, 6, 7, 8, are the deterrent sizes of the shoes worn by the students.
(d) 7 size is worm by the maximum number of students.
(e) number 8 size is worn by minimum number of student.
(f) The given statement is False.
Question no – (38)
Solution :
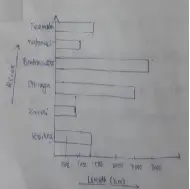
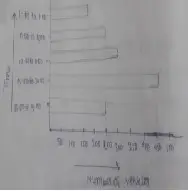
(a) 295 tickets were sold in all.
(b) The minimum number of tickets sold for Delhi
(c) The minimum number of tickets sold for Chennai
(d) The number of the tickets more than 20 for Delhi, Patna, Jaipur and Guwahati
(e) Number of tickets sold for Delhi and Jaipur together exceeds the total number of tickets sold for Patna and Chennai by 50.
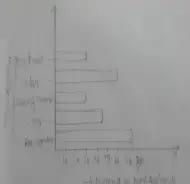
Question no – (39)
Solution :
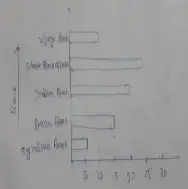
(a) N.H.2 is the longest among the above.
(b) N.H – 10 is the shortest among the above.
(c) The length of national Highway 9 is 900 km.
(d) Length of N.H.8 is about three times the national Highway.
Question no – (40)
Solution :
(a) What is the circulation of English newspaper?
= 1000 is the circulation of English Newspaper
(b) Name the two languages in which circulation of newspaper is the same.
= In Marathi and Bengali the circulation of Newspaper is same.
(c) By how much is the circulation of newspaper in Hindi more than the newspaper in Bengali?
= 800 more than the newspaper in Bengali.
Question no – (41)
Solution :
(a) Number of students in different years.
(b) In 2005-06 the number of students is minimum.
(c) In 2004-05 is the number of students twice as that of 2001-02
(d) In 2003-04 year the number of students decrease as compared to previous year.
(e) In 2004-05 the number of students maximum as compared to the previous year.
Question no – (42)
Solution :
This Bar graph represent the above information :
Scale : 1 unit = 500 km.
Question no – (43)
Solution :
This Bar graph represent the above information,
Question no – (44)
Solution :
This bar graph to represent the above information.
Scale : 1 unit = 5000
Required Bar Graph,
Question no – (45)
Solution :
Given bar graph representing the above data.
Required Bar graph :
Question no – (46)
Solution :
This bar graph represent the above information.
Scale : 1 unit = 25000
Required Bar Graph :
Question no – (47)
Solution :
This bar graph represent the above data.
Scale : 1 unit = 10 school
Required Bar graph :
Question no – (48)
Solution :
Given bar graph represent the above information.
Required Bar graph :
Next Chapter Solution :